Trade Value up by
about 17% in the Fourth Quarter of 2010
The value of world merchandise trade was 17% higher
in the fourth quarter of 2010 compared to the same period of 2009, according to
WTO figures released on 14 March 2011.
These short-term “value” figures should
not be confused with the annual trade growth figures, which are “volume” data
using “constant dollars” with inflation taken into account.
Over the year 2010, merchandise exports
increased by 22% in value. A more comprehensive analysis of the annual picture
with statistics in volume terms, the latest trends and a forecast for the
coming year will be released in early April.
Moreover, WTO short-term merchandise
trade values are not seasonally adjusted. Seasonal patterns therefore
considerably affect the quarter on quarter (Q-o-Q) and month on month (M-o-M)
developments in world trade, and this in turn affects comparisons between the
trade developments in individual regions and economies.
Chart
1: World merchandise exports, first quarter 2007 to fourth quarter 2010
Indices, first quarter 2005=100
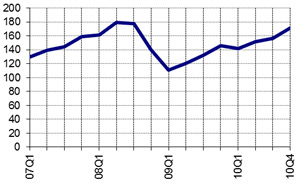
Available monthly statistics for about
70 economies representing more than 90% of world trade show that merchandise
trade decreased in December 2010, reflecting in good part seasonal variations.
Nonetheless, this year-end value is above the comparable pre-crisis level of
December 2008.
Chart
2: Monthly merchandise trade 2008-2010, aggregate of 70 economies
Trillion dollars
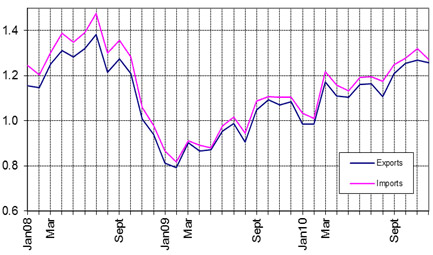
a
Imports are valued cif (cost, insurance and freight included) while exports are
fob (free on board).
Overview of regional trade flows
Comparing the fourth quarter of 2010 with the same
period in 2009, the region with the largest growth rate was South and Central
America with exports growing by 25% and imports by 30%.
Asian exports rose by about 23% and imports by
around 22% on a “year-on-year” basis.
Table 1: World merchandise trade
by region and selected economies, October-December 2010
Percentage change in current US dollars, year-on-year and quarter-on-quarter
|
Exports |
|
|
Imports |
|
|
Y-o-Y Q-o-Q |
|
|
Y-o-Y Q-o-Q |
|
|
17 |
9 |
World (a) |
17 |
7 |
|
18 |
9 |
North America |
16 |
1 |
|
18 |
9 |
United States |
16 |
0 |
|
17 |
10 |
Canada |
15 |
2 |
|
25 |
4 |
South and Central America |
30 |
1 |
|
38 |
2 |
Brazil |
34 |
-3 |
|
10 |
12 |
Europe |
12 |
12 |
|
10 |
12 |
European Union (27) (b) |
11 |
11 |
|
7 |
13 |
intra EU |
7 |
13 |
|
14 |
10 |
extra EU |
18 |
9 |
|
17 |
14 |
Commonwealth of Independent
States (CIS) |
23 |
13 |
|
18 |
15 |
Russian Federation |
26 |
11 |
|
21 |
16 |
Africa and the Middle East |
13 |
8 |
|
23 |
5 |
Asia (a) |
22 |
5 |
|
25 |
3 |
China |
30 |
4 |
|
28 |
16 |
India |
2 |
2 |
|
19 |
5 |
Japan |
21 |
5 |
|
21 |
6 |
Six East Asian traders
(c) |
22 |
5 |
a
Includes significant re-exports or imports for re-exports.
b
“Intra EU” is trade within the EU; “extra EU” is trade between the EU and
non-EU economies
c
Hong Kong, China (excluding re-export trade), Republic of Korea, Malaysia,
Singapore, Chinese Taipei, and Thailand
Chart 3: Commodity price
developments, fourth quarter 2010
Percentage change
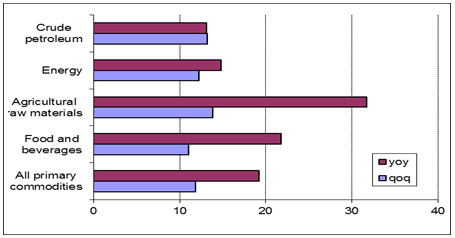
Source: IMF